Detecting Problems Before They Occur
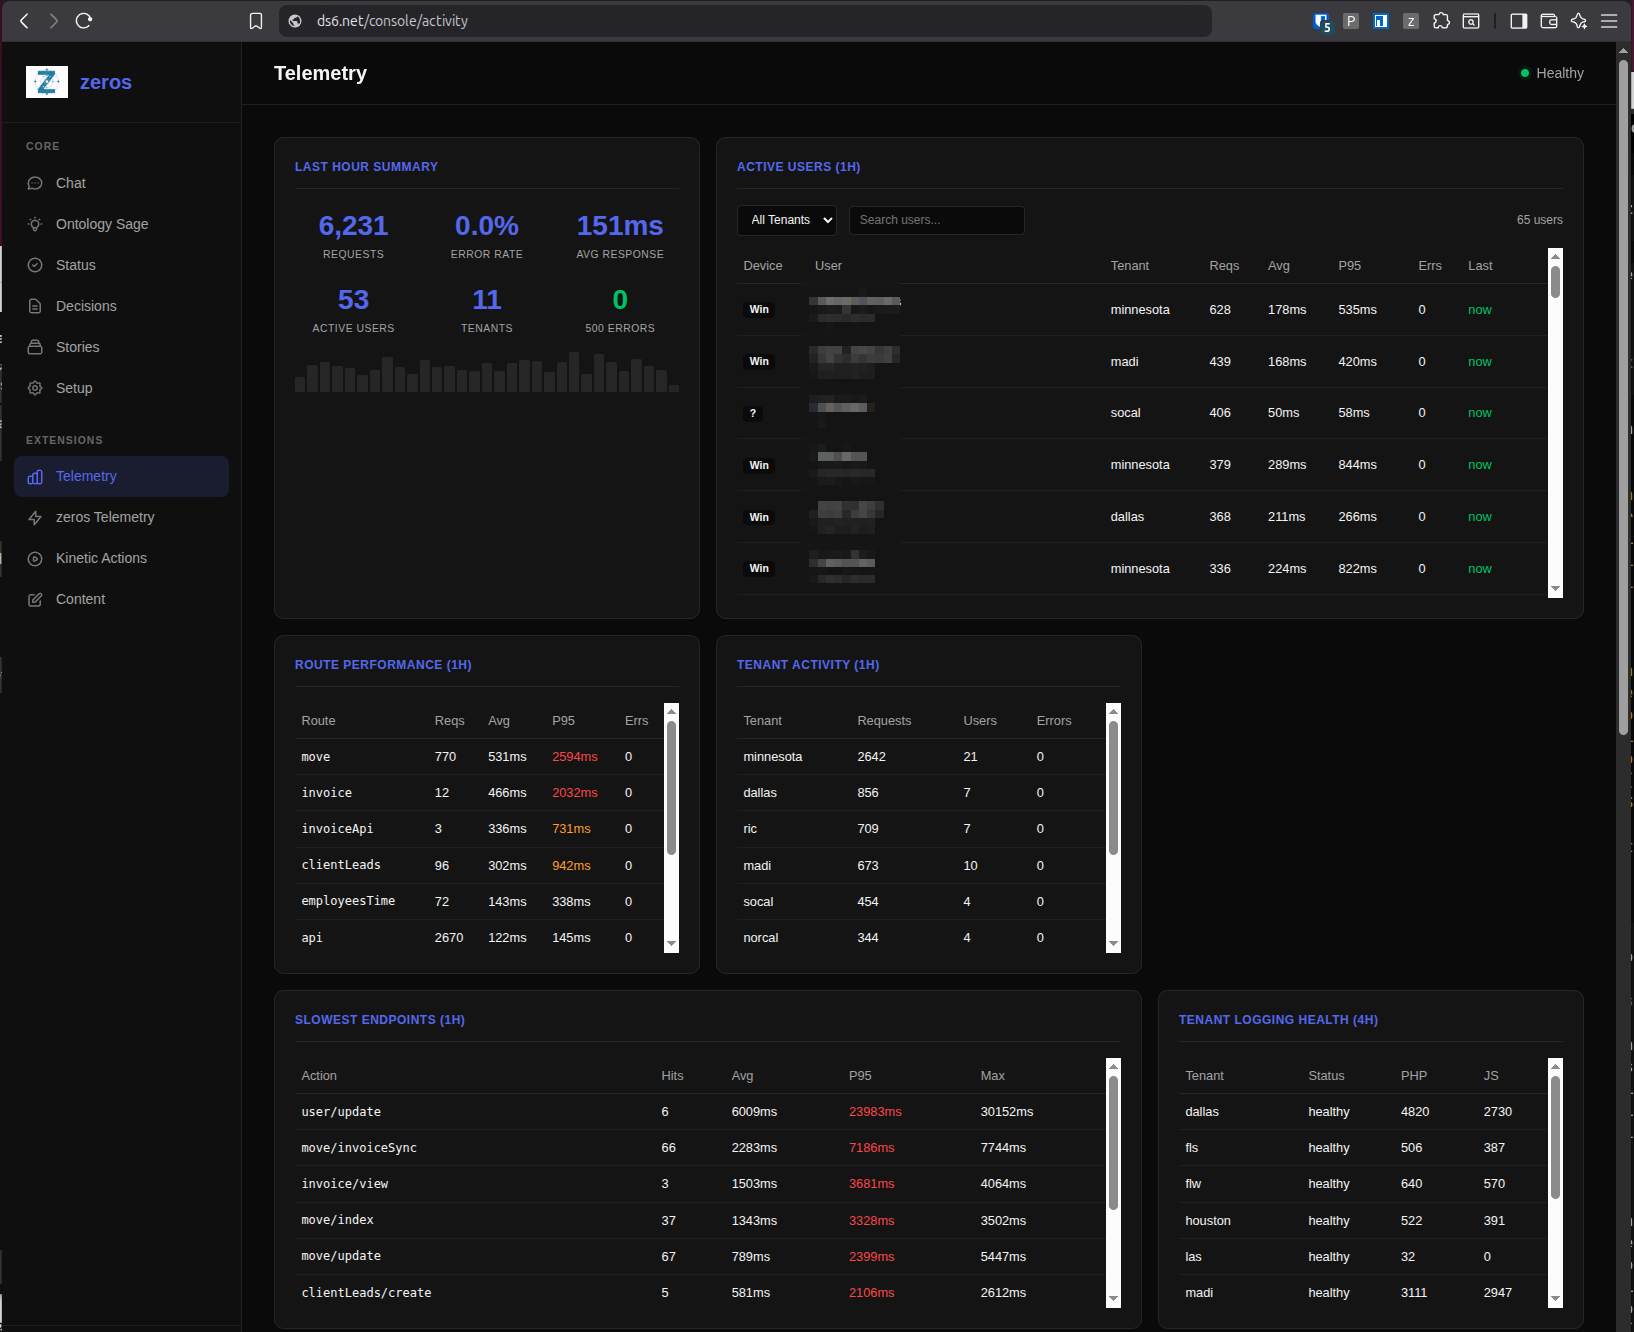
Our telemetry dashboard monitors every request, flagging outliers before they become incidents. See that orange P95? That's zeros saying "this endpoint is behaving differently than usual."
An anomaly is an anomaly. The domain doesn't matter.
- Endpoint at 2594ms when baseline is 531ms → same pattern as...
- Customer payment 45 days late when baseline is 12 days → churn risk
- Mill temperature at 847°F when baseline is 720°F → equipment failure coming
- Sales rep close rate at 8% when baseline is 30% → coaching needed
Sage: Walking the Graph Overnight
While you sleep, Sage traverses your knowledge graph — finding gaps, detecting anomalies, and surfacing insights you didn't know to ask about. This is what proactive intelligence looks like.
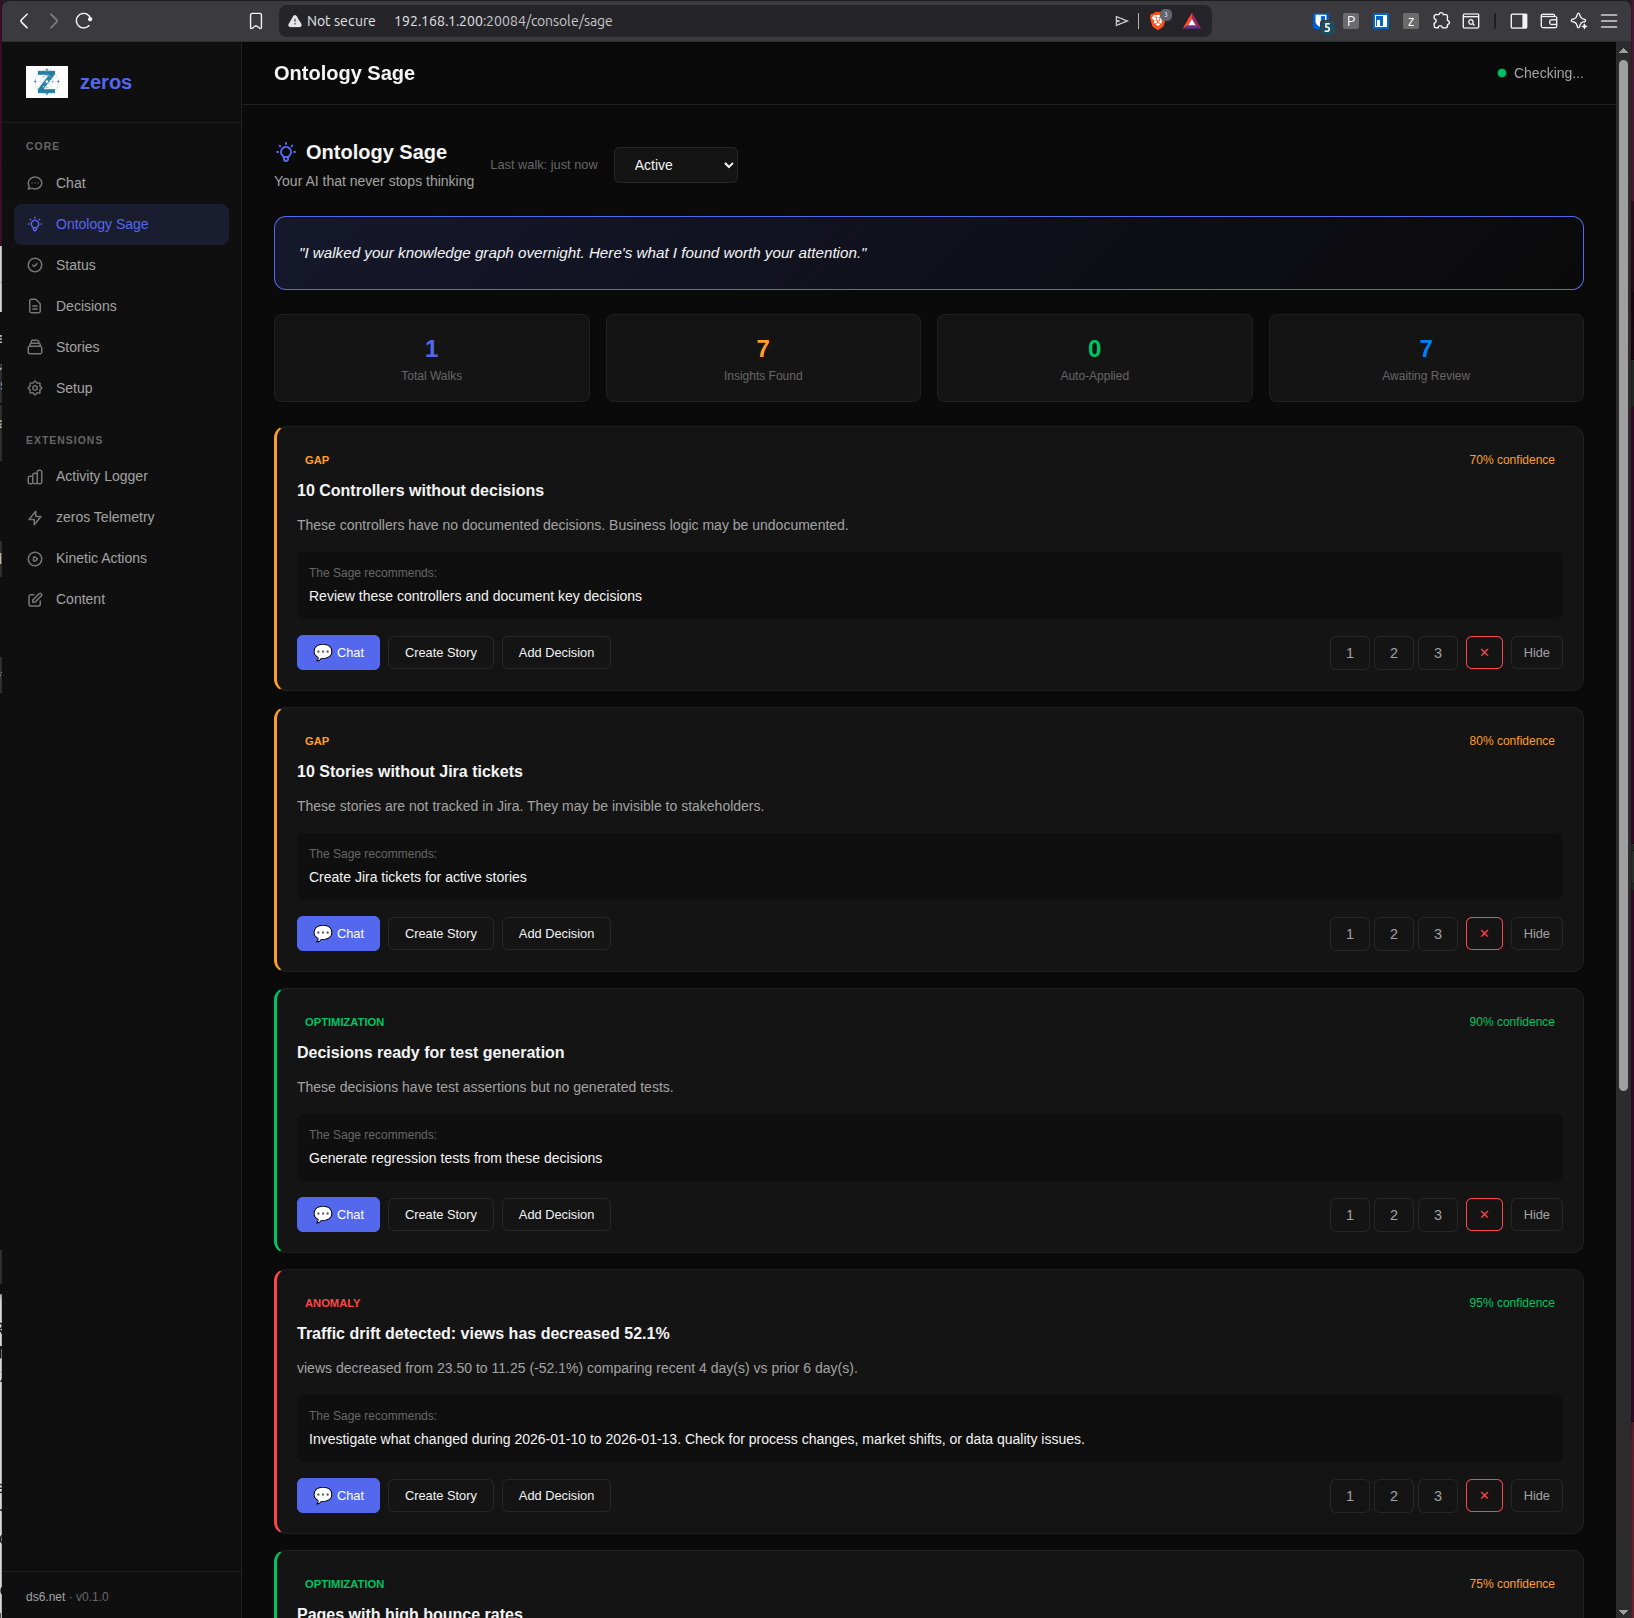
Each insight comes with a confidence score and recommended action. Click "Chat" to dig deeper, "Create Story" to track it, or "Add Decision" to record what you learn. zeros doesn't just find problems — it helps you build institutional knowledge from them.
⚠️ The Insight You're Paying For
You're not paying $25K/month for dashboards you can build yourself. You're paying for zeros to discover what you don't know to ask about.
Here's what Sage found this week:
- Customer sliding toward churn: ACME Corp hasn't logged in for 17 days, opened 3 support tickets with negative sentiment, and is still on old pricing tier. 92% churn risk in 14 days. Reach out now.
- Revenue pattern recurring: Your top 3 sales reps all underperformed quota in June, same as 18 months ago when you lost the enterprise deal. Summer slowdown is real—plan for it.
- Institutional knowledge recovered: Sage found the 2019 Slack thread where you said "never support feature X"—extracted the reasoning, recorded it as a decision. New hires won't waste time on dead features.
- Cost anomaly detected: Your infrastructure costs are up 47% this month but traffic only 12%. Someone spun up an expensive database—cancel before next billing.
- Predictive hiring signal: Based on 3 years of patterns, you'll need 2 support staff in March. Start recruiting in January, not February.
These aren't alerts you set up. These are unknowns Sage discovered by walking your ontology—connecting customer data with support tickets, correlating seasonal patterns, finding institutional context you forgot existed. The value is in the unknowns, not the metrics you already track.
Autonomous Exception Triage
When production errors occur, zeros doesn't just alert — it investigates. Our kinetic actions pipeline automatically diagnoses exceptions, creates Jira tickets, and prepares fixes for human review.
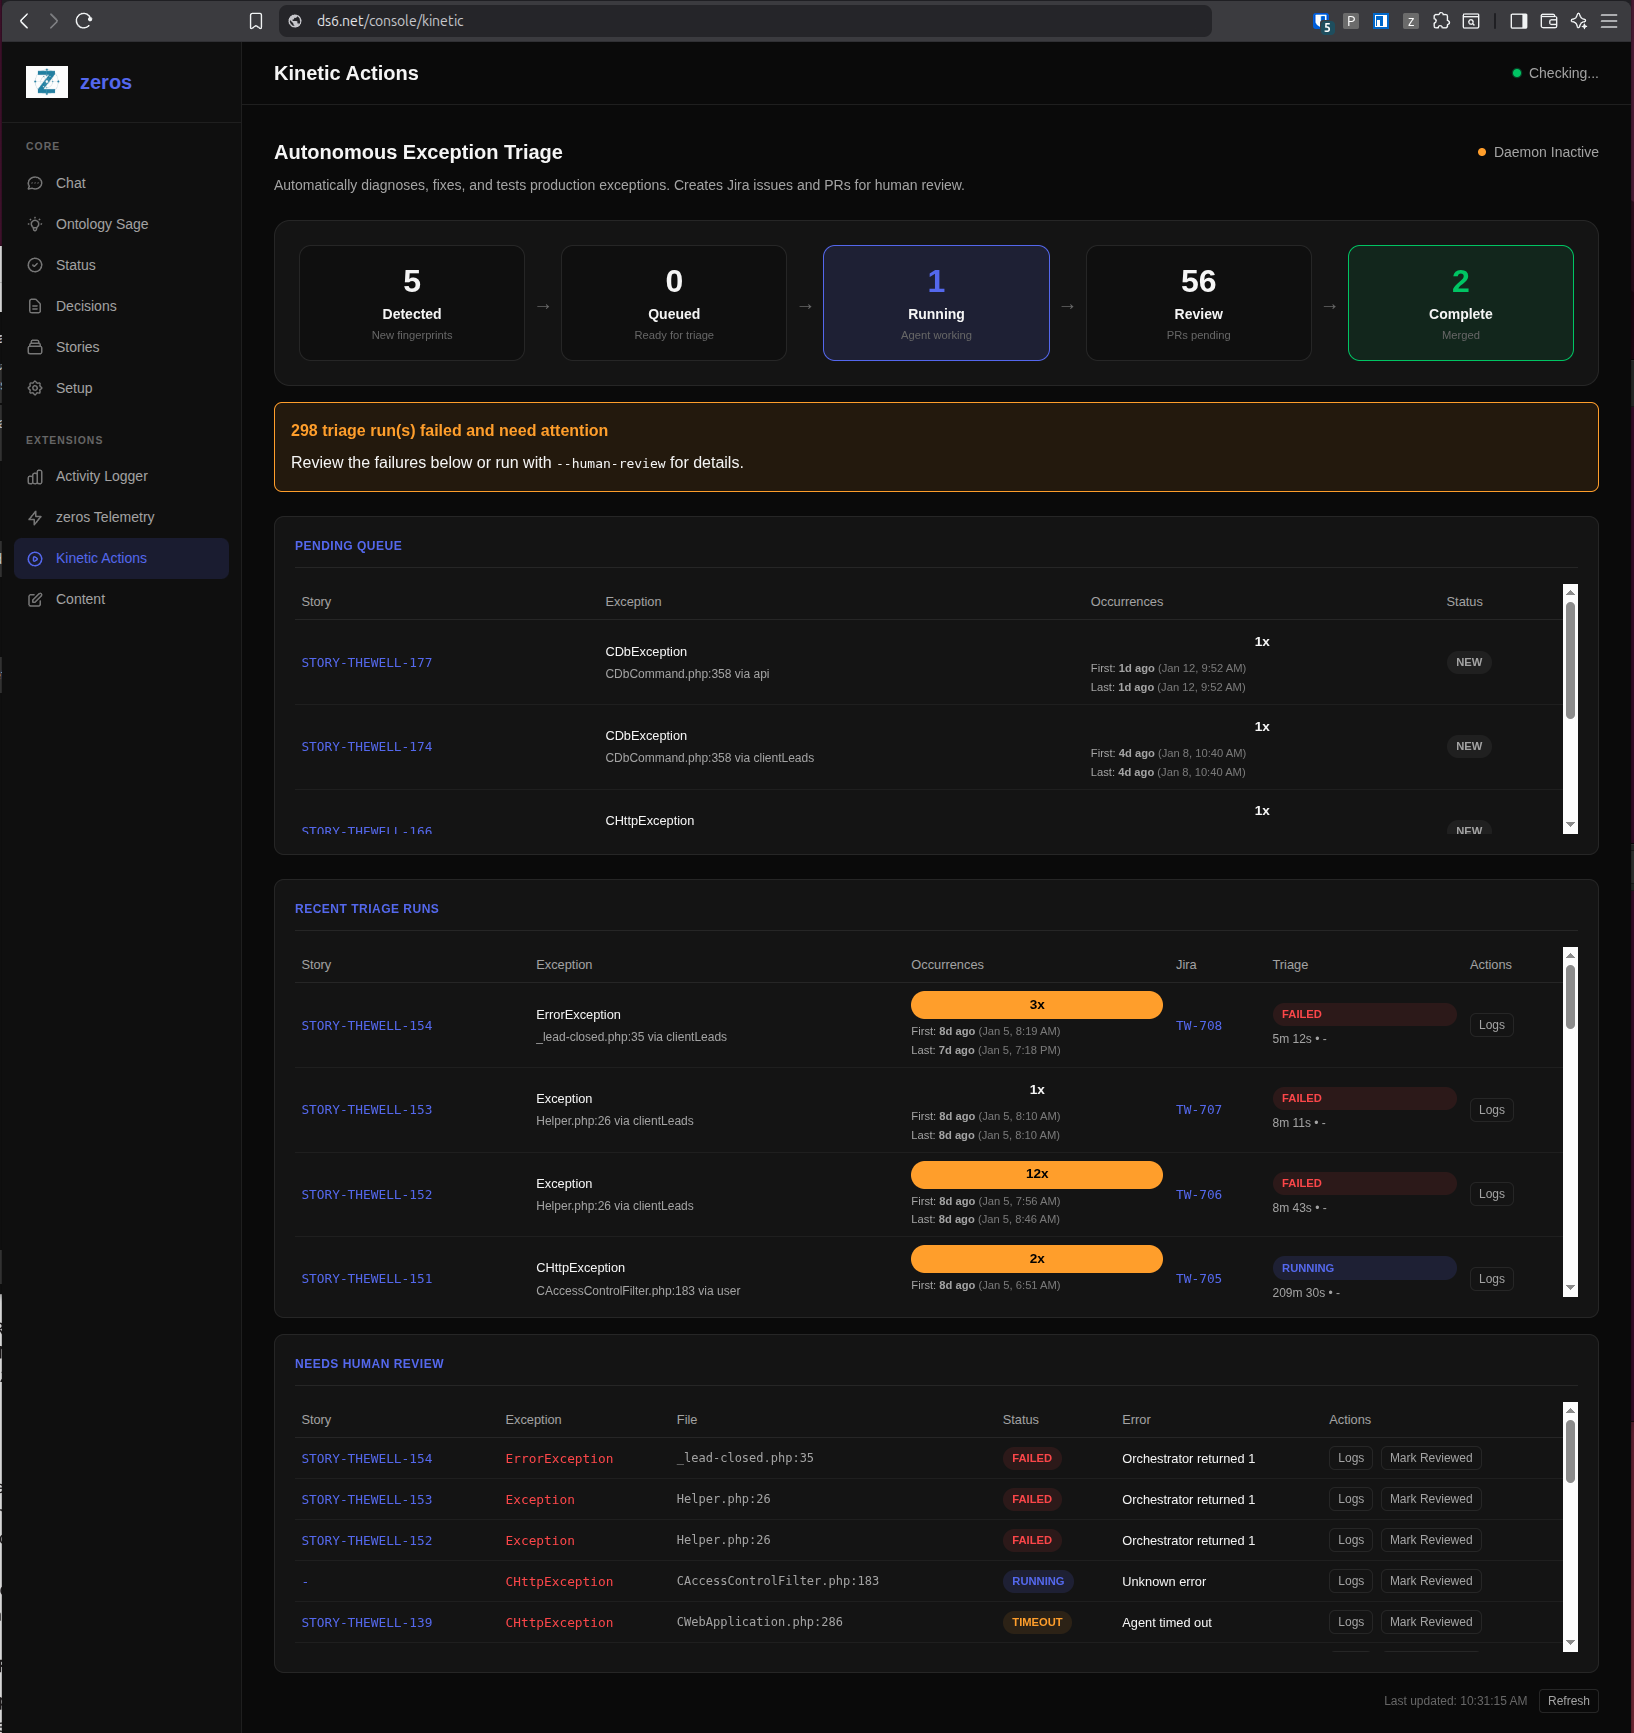
This is a kinetic action — a predefined response that executes automatically. The same pattern works for any trigger: customer health score drops, inventory falls below threshold, contract renewal approaches. You define the rules; zeros executes them.
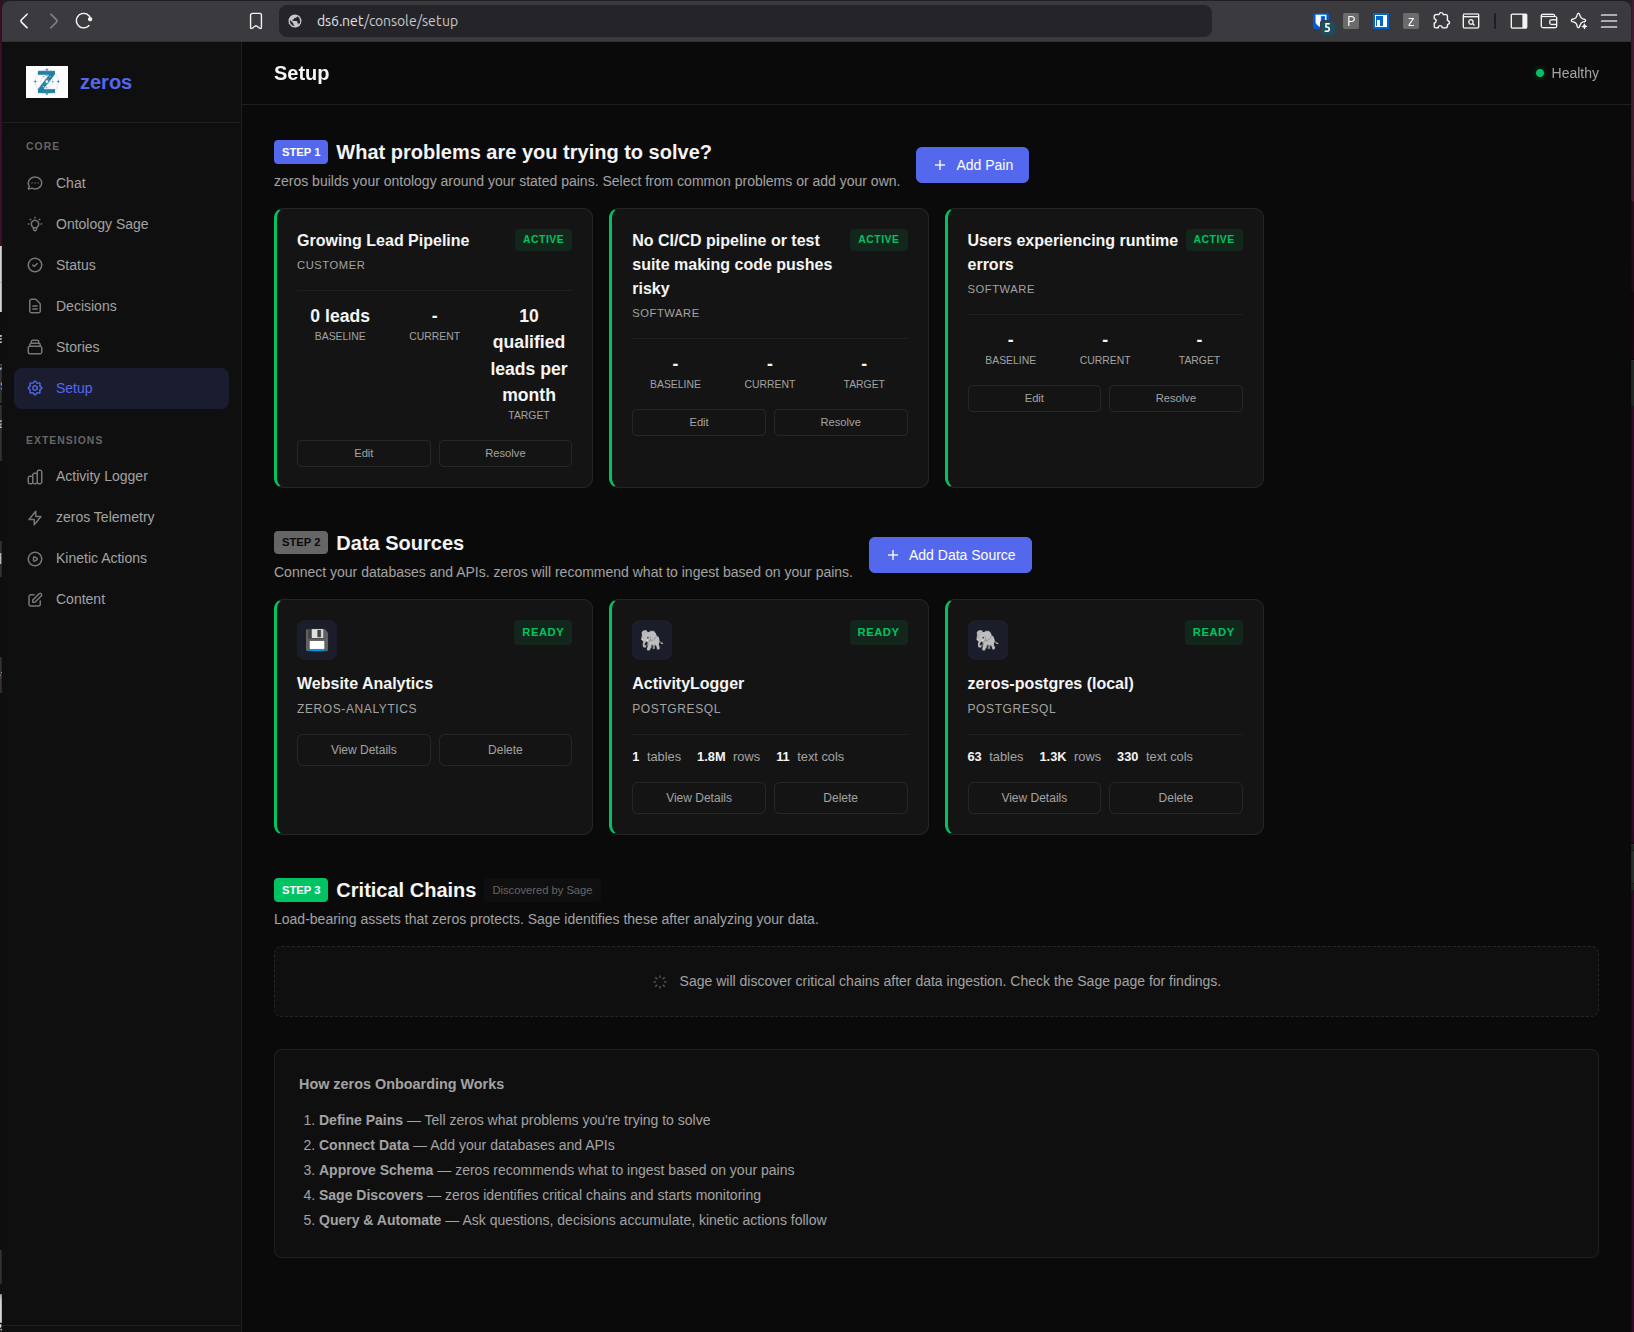
Connect Your Data in Minutes
zeros connects to your existing systems — databases, APIs, SaaS tools. Read-only access, PII sanitized before analysis. You keep control; zeros provides intelligence.
What This Means For Your Business
At $25K/month, you're not buying software. You're hiring an AI system that proactively finds:
You don't know what you don't know. zeros finds out every night.
What Unknowns Would Sage Find in Your Business?
15 minutes. No pitch deck. Just your questions about what's possible.
Let's Talk